Can a metabolic network be drawn the way a curator would draw it?
MetaCarto turns any genome-scale model into publication-quality Escher maps by construction — no annealing, no random seed, no hand editing
Project Overview
Genome-scale metabolic models are routinely solved and almost never drawn. The reason is that a force-directed layout of a few thousand reactions returns a hairball: every cofactor is a hub, every hub drags its neighbours together, and the pathway structure a biochemist would recognise disappears. Curators therefore draw maps by hand, which is why so few exist.
MetaCarto reads a BiGG/SBML model and lays it out the way a curator would — linear pathways as straight backbones, cycles as rings, cofactors pushed out as side branches — and emits schema-correct Escher JSON that loads in any Escher viewer. The layout is constructive and deterministic: the same model always produces the same map.
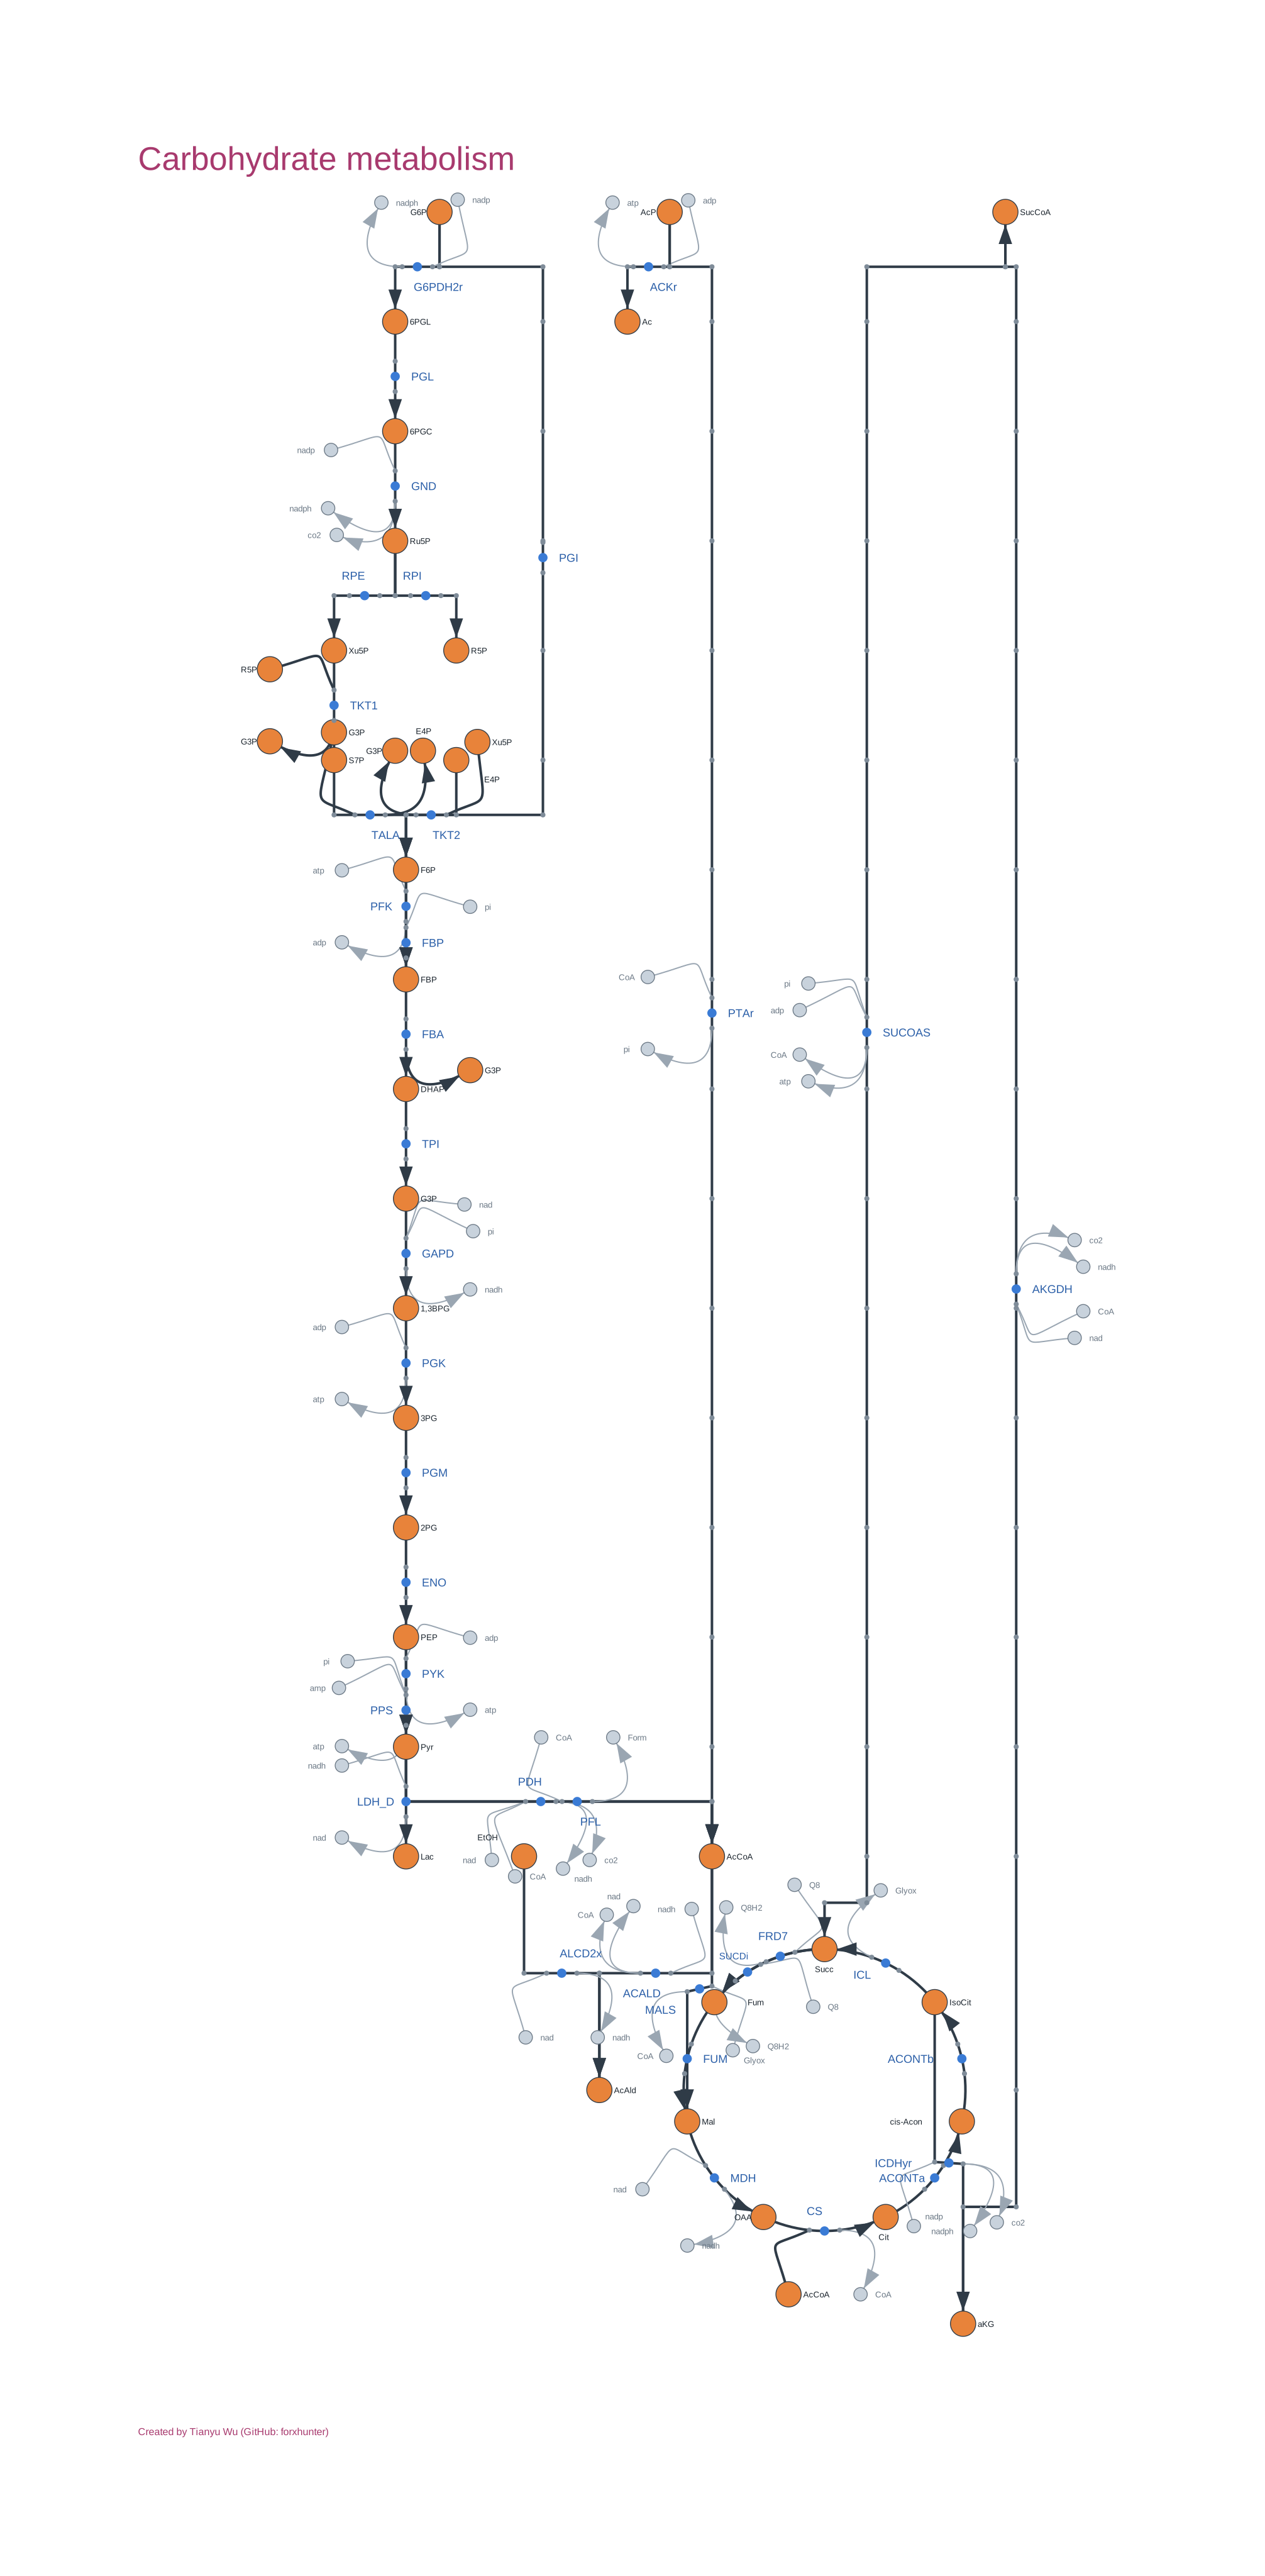
Browse the full collection in the interactive viewer via Map ▸ Load map from library… — it reads the published collection directly, with nothing to download.
Research Goals
Make the drawing step of genome-scale metabolism reproducible, so that a map is a derived artifact of a model rather than a hand-made figure.
Recover the pathway structure a biochemist expects — backbones, rings, side branches — from the network alone, without curator input.
Emit output that is valid in an existing ecosystem rather than a bespoke format, so the maps are immediately usable.
Score every map against explicit legibility gates instead of judging layouts by eye.
How It Works
1. Primary-compound reduction
A reaction such as pyruvate + CoA + NAD⁺ → acetyl-CoA + CO₂ + NADH contributes one directed edge, between the substrate/product pair sharing the most molecular skeleton — here pyruvate → acetyl-CoA. Everything else becomes a side branch. Without this reduction each reaction node has degree 4–8 and no clean orthogonal drawing exists, which is precisely why naive layouts hairball.
Cofactor-ness is applied as a tier, not a score penalty: a curated or high-degree cofactor is never selected while a non-cofactor alternative exists on its side. That is what stops CoA → acetyl-CoA, which shares 21 carbons, from beating pyruvate → acetyl-CoA.
2. Direction from flux
Reconstructions store reversible reactions in whichever direction the curator happened to write them, so glycolysis is often recorded partly backwards. Parsimonious FBA decides the drawn direction wherever a reaction carries flux, and antiparallel pairs are collapsed onto a single axis.
3. Cycles drawn as cycles
Rings are detected on the whole-model graph, contracted for layering, then expanded onto a circle rotated so the entry arc faces the pathway feeding it — which is why the TCA cycle above reads as a cycle rather than as a tangle.
4. Layered placement
Greedy feedback-arc-set, layer assignment, cluster-constrained crossing reduction, then Brandes–Köpf coordinate assignment. That last step is what produces straight vertical backbones; a barycentre assignment does not.
5. Two scales
The whole-model map runs the same layered pass one level up: each cluster drawing becomes a tile, tiles are ordered by metabolic flow, and the result is packed into a captioned poster.
The Generated Collection
All 108 models in the BiGG database are published as 2,621 pathway maps covering 240,398 reactions, as both Escher JSON and SVG, under CC BY 4.0 — including Recon3D at 10,600 reactions across 93 maps.
Reactions are assigned to maps from the model’s own subsystem annotation where one exists, then from a KEGG pathway lookup, and only failing both from network structure via greedy-modularity communities on the currency-stripped graph. Many BiGG models carry no subsystem annotation at all, so the structural fallback is a normal path rather than an edge case.
Quality Gates
Every emitted map is scored on edge orthogonality, crossings per edge, longest straight run, node separation, three kinds of label collision, local density, occupancy and aspect ratio, and the run exits non-zero if any gate fails. Three further gates cover print legibility — label size in points once the map is fitted to a journal column — title/caption collisions, and canvas overflow.
Known Limitations
- A few reactions per model have no drawable primary pair — typically small inorganic chemistry such as catalase or CO₂ transport — and are omitted.
- Whole-model composed maps are not print figures. Tiling 10,600 reactions onto one canvas leaves each reaction so little area that labels land near 0.14 pt. The per-cluster maps are the readable artifact.
- Local density still exceeds its target on most large merged function maps.
- H⁺ and H₂O are suppressed from every map.
- Compartments are not drawn as envelopes, because the Escher schema has no region primitive.